-
楼主 / hammer
- 时间: 2011-7-20 22:33
-
-
- 时间: 2011-7-21 07:037-21-2011
Goog 开594.03 目前598.49 无量 继续判断可以做空
.Aapl开386.95 目前385.48 近期看空short,但明天不知。因为会回
.Nwsa 开 16.24目前16.33 估计还有上幅上涨空间
金价 1598.10又逼近高点
道指:高开
全球金融形势
1欧盟达成希腊协议
2加元强劲,不利出口
Canadian dollar jumps to 3.5 year high on prospect of higher interest rates
By Malcolm Morrison, The Canadian Press
TORONTO - The Canadian dollar surged to a three-and-a-half year high Thursday as the Bank of Canada prepares markets for an eventual hike in interest rates while nervous investors diversify some holdings into the loonie.
3Express Scripts will buy Medco for $71.36 per share in tie-up of biggest drug benefit managers
看看会不会带升医药股上升
复盘回顾
昨对aapl判断准确。果然是跌
新增观察
油价股 金子推荐HOU.TO 看了一下。10元阻力位较大
SDX.V
食品股
天线宝宝推荐MCD
乡村小推荐店KO
以上两个目前都高了,不是进场时机 -
-
- 时间: 2011-7-22 07:09
-
- 时间: 2011-7-22 21:55加拿大统计局出炉2011年6月通胀报告
OTTAWA — The pace of inflation unexpectedly cooled in June, despite jumps in the cost of gasoline and basic foodstuffs.
Statistics Canada said the annual inflation rate was 3.1 per cent in June, down from 3.7 per cent in May.
The Bank of Canada's core rate was 1.3 per cent. This excludes eight of the most volatile components in the consumer price index -- including fruit and vegetables, fuels, tobacco products and mortgage interest costs as well as the effect of indirect taxes.
The statistics agency said much of the drop in the rate from June was due to lower prices for passenger vehicles because of manufacturers' discounts and lower costs for travel accommodation.
Economist Avery Shenfeld of CIBC called the report "shocking on the low side."
Doug Porter, deputy chief economist for BMO Capital Markets said: "Overall, big surprise, big relief."
The news likely will ease pressure on the Bank of Canada to act on interest rates.
While the pace of inflation slowed, higher prices for gasoline and food bought from stores kept the rate above three per cent.
Food prices rose 4.8 per cent from June of 2010 and overall energy prices were 15.7 per cent higher than a year earlier.
The price of gasoline was 28.5 per cent higher on a year-over-year basis, although it actually dropped slightly compared with May.
The inflation report came just days after the Bank of Canada said it would keep its key interest rate at one per cent.
Porter said the latest figures give the bank some time.
"Today's much more benign reading for both headline and core inflation takes the near-term pressure off the Bank of Canada to do anything quickly on rates -- assuming of course we don't get yet another massive reversal in prices next month."
Shenfeld said the report likely surprised the central bank, especially the core rate.
"All told, some key breathing room for the (bank) since even though the core rate will likely drift up as some low numbers drop out from the 12-month calculation in the coming quarter, odds now favour it remaining below two per cent."
Consumers were still paying more for many commodities.
The cost of transportation rose 7.0 per cent on an annual basis to June. In addition to higher gas prices, drivers paid 4.4 per cent more for insurance.
The cost of air travel was 7.6 per cent higher.
Food prices rose broadly on a year-to-year basis. Meat prices increased 5.9 per cent, while the cost of bread jumped 10.1 per cent and fresh vegetables cost 8.4 per cent more.
The cost of restaurant meals, however, rose by only 3.3 per cent.
Shelter costs rose 1.7 per cent from June 2010, with higher prices for fuel oil, electricity. However, mortgage interest costs slipped 1.9 per cent and natural gas was also cheaper.
Cable and satellite services cost 7.9 per cent more than in June 2010.
The pace of inflation slowed in every province compared with May. Nova Scotia had the fastest increase in consumer prices at 4.4 per cent, while Alberta had the slowest, at 2.1 per cent.
www.ctvbc.ctv.ca/servl...lumbiaHome -
- 时间: 2011-7-23 07:22
-
- 时间: 2011-7-23 07:23
-
- 时间: 2011-7-23 07:43周末技术学习:
1死亡叉信号
Believe it or not, despite a rising market, there are a number of notable death crosses in economically sensitive sectors/markets.
Death cross. It sounds dangerous, but is it something we should worry about right now? What is a death cross? Which indexes are marked by the death cross and what does it mean for the stock market?
A death cross occurs when the 50-day simple moving average (SMA) drops below the 200-day SMA and shows that the market is losing momentum. It is never a bullish signal but is not always 'deadly' bearish.
以下为举例
A number of economically sensitive industry sectors and asset classes just saw such a bearish crossover of the moving averages.
Banks & Financials
Bank of America is trading at its lowest price since May 2009.
JP Morgan is trading at its lowest price since November 2011.
Citigroup is within striking distance of its 52-week low.
Goldman Sachs is the lowest it's been since April 2009.
Together those four companies account for 25% of the Financial Select Sector SPDR (NYSEArca: XLF - News). It may not be a surprise to some to find the financial sector marked by a death cross, although it should be.
No sector benefitted more from QE2 than banks (NYSEArca: KBE - News) and financials. Banks not only got to borrow money for next to free, they also got more than a trillion dollars to invest in a stock market that's more than doubled since the 2009 low.
If bank and financial stocks can't rally in this environment, when can they? The market obviously knows something investors don't. With or without the SMA crossover, the weakness of financials is longer-term troublesome.
2,黄金叉信号---铜有能力预知未来股市的走势。
Rebound Related Commodities
There are a number of commodities that should be getting more expensive in a rebounding economy. Out of all the commodities, copper is the only one said to have a PhD in economics. As an industrial metal, copper is used in everything from houses to tech gadgets. It's therefore said that it has an ability to foretell the future for stocks.
The 50-day copper SMA crossed below the 200-day SMA on June 23. Ironically, this crossover has been more of a buy than a sell signal, as prices have been rising and the SMA's are just about ready to create a 'golden cross.' That's when the 50-day SMA moves above the 200-day SMA.
Steel is a staple in the building industry. No big construction project can be built without steel. Steel prices are somewhat reflective of global construction activity. Steel prices saw a death cross on June 20. The silver lining here is that the 20-day SMA has crossed back above the 50-day SMA just a few days ago. This is a mini golden cross.
The United States Oil Fund just saw a death cross; however the 50-day SMA for the actual oil price futures has yet to slice below the 200-day SMA. Just a few months ago, the media spoon-fed us that rising oil prices are a sign of the worldwide economic recovery. If that logic is correct, what do falling or stagnant oil prices mean?
3.SMA是一个滞后指标
China
The Shanghai Composite and the iShares FTSE China ETF (NYSEArca: FXI - News) just saw a death cross. The richest country in the world has seen stocks slide continuously since the 2007 top.
Emerging markets (NYSEArca: EEM - News) produced a death cross yesterday and the broad MSCI EAFE Index (NYSEArca: EFA - News) is just a few days away from the nearly inevitable.
What Does it Mean?
Obviously, SMA crossovers are a lagging indicator. In most cases it takes several months of declining prices before a death cross appears. By the time the 50-day SMA drops below the 200-day SMA, a large portion of the (initial) decline may already be over (see copper).
This doesn't mean that the death cross is unreliable as a buy/sell signal. In fact, there've been nine crossovers (death and golden crosses combined) for the S&P (NYSEArca: SPY - News) since 2000. Six signals turned out to be accurate with an average gain of 19.35%. Three signals were wrong and led to an average loss of 10.15%. 66% accuracy with a 2:1 risk/reward ratio is not shabby.
There hasn't been a death cross in the S&P but based on the indicators discussed above, now is not the time to embrace stocks unconditionally. The VIX (Chicago Options: ^VIX) is within striking distance of the 16 level. Every decline below 16 over the past years has resulted in nasty sell offs.
If you wait for a death cross for the S&P before selling, you may have to stomach a drop below 1,250 before getting a SMA crossover sell signal. Who wants to lose 5 - 10% before getting a sell signal?
On the other hand, who wants to lock in gains now and forfeit future potential gains?
4关于阻力位
Best of both Worlds
Making trade or investment decisions solely based on SMA crossovers is like communicating via snail mail if you could use e-mail - any received message is delayed.
A more effective and pro-active approach is to identify significant support or resistance levels. Since the market tends to react to major resistance levels, it is prudent to sell against resistance while buying against support. Support/resistance levels are fractal and can be used by long-term investors as well as swing or even day traders.
Using important Fibonacci levels and trend lines that stretch over two decades, the ETF Profit Strategy Newsletter identified trouble (resistance) ahead previously on April 3, 2011: 'In terms of resistance levels, the 1,369 - 1,xxx (reserved for subscribers) range is a strong candidate for a reversal of potentially historic proportions.'
This was followed up by a May 1 recommendation to short the S&P against the first Fibonacci resistance at 1,369.
What about support? On June 15, the ETF Profit Strategy Newsletter stated that: 'The 200-day SMA at 1,257 is sandwiched between the 1,255 Fibonacci projection level dating back to 2002 and this week's s1 at 1,259. Wednesday's low was at 1,261.9. If this low is not enough, there is a strong cluster of support at 1,259 - 1,245. A drop into the 1,259 - 1,245 range would prompt us to close out short positions and leg into long positions.'
Keep in mind that all this action happened within a period of time that was void of any 50/200-day SMA crossovers.
Will the S&P (SNP: ^GSPC) and other major indexes like the Dow Jones (DJI: ^DJI) and Nasdaq (Nasdaq: ^IXIC) challenge their previous highs?
They may, but no death cross will ring a bell at the top and none of the above mentioned death crosses may prevent a new recovery high.
Resistance levels, on the other hand, have a much better track record of identifying important resistance points and market tops.
The ETF Profit Strategy Newsletter uses complex technical analysis to identify important support/resistance levels and accompanying trade recommendations. The most recent update shows the likely target range for a large-scale market top. -
- 时间: 2011-7-23 07:452,黄金叉信号---铜有能力预知未来股市的走势。
Rebound Related Commodities
There are a number of commodities that should be getting more expensive in a rebounding economy. Out of all the commodities, copper is the only one said to have a PhD in economics. As an industrial metal, copper is used in everything from houses to tech gadgets. It's therefore said that it has an ability to foretell the future for stocks.
The 50-day copper SMA crossed below the 200-day SMA on June 23. Ironically, this crossover has been more of a buy than a sell signal, as prices have been rising and the SMA's are just about ready to create a 'golden cross.' That's when the 50-day SMA moves above the 200-day SMA.
Steel is a staple in the building industry. No big construction project can be built without steel. Steel prices are somewhat reflective of global construction activity. Steel prices saw a death cross on June 20. The silver lining here is that the 20-day SMA has crossed back above the 50-day SMA just a few days ago. This is a mini golden cross.
The United States Oil Fund just saw a death cross; however the 50-day SMA for the actual oil price futures has yet to slice below the 200-day SMA. Just a few months ago, the media spoon-fed us that rising oil prices are a sign of the worldwide economic recovery. If that logic is correct, what do falling or stagnant oil prices mean?

-
- 时间: 2011-7-24 06:5607-24-2011
全球金融形势
1挪威袭击案死亡93人
Economy of Norway:
The first oil field was Ekofisk, produced 427,442 barrels (67,957.8 m3) of crude in 1980. Since then, large natural gas reserves have also been discovered.
挪威的石油输出仅次于沙特阿拉伯和俄罗斯。可能影响油价,带动上升
2加币有跌的预期
复盘回顾
GOOG 上涨1.85%,最高619.5 曾经吊高620想做short,没入到
Aapl上涨1.55%,最高395.05
对这两股判断都不正确,但仍在范围内,量还在萎缩。希望跳高大涨,然后做空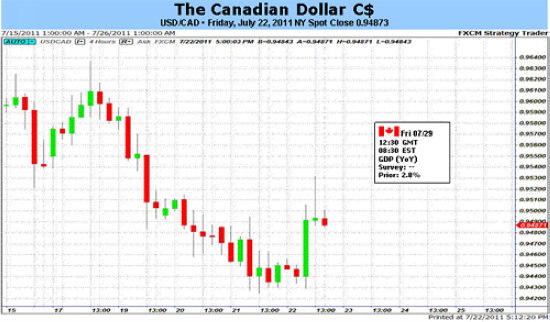
请点击图片查看原图 -
- 时间: 2011-7-24 07:19
资料贴之三----自言自语之全球金融动态、黄金价格跟踪、每周不定期综述


