免費下載安卓app: 實時股市報價及信息方陣圖
play.google.com/store/...ktile.free
Up to the minute real time quotes are now available for US, Canada, Indian (NSE), Australia and London stocks!
Real-time Stock Quotes and color Tiles View (or StockTiles © with widget) is an exciting Android app to view and manage your stock portfolio! Instead of an old boring list, your stocks are a represented by collection of color coded tiles, with real time quotes allowing user to see clearly all the important information in the portfolio at one glance!
StockTiles is also a full-featured stock quote, charts, news and portfolio management software as follows:
Key Features:
- Real Time Quotes! (for US, Canada, Australia, NZ, London exchanges)
- Color coded tiles display intuitive information!
- Home screen widgets (scrollable and customizable skins!)
- Sort tiles by name, daily %change, position performance, technical / fundamental indicators and more!
- Real-time RSS News Feed! from various sources:
- Bloomberg, Yahoo finance, Motley Fools, CNN, CNBC, Reuters etc...
- Customizable Charts!
- Line chart, Bar chart, Candlestick, (Trendline charts optional)
- Overlays: Moving Averages: 5, 10, 20 ,50 ,100, 200, EMA: 5, 10, 20 ,50, 100 ,200; Bollinger Bands, Parabolic SAR, Splits, Volume
- Technical Indicators: MACD, RSI14, MFI, ROC, Slow/Fast Stochastic, Volume&MA, William %R
- Portfolio performance and Alerts!
- Dividend payout adjustment
- All Major Markets supported (more than 10000 stock symbols):
United States: NASDAQ, NYSE, AMEX
Canada: TSX
Asia: HKEX, Australia, New Zealand, India (NSE)
Europe: London, Paris, Brussels, Amsterdam, Milan, Madrid
- Preloaded portfolios:
NASDAQ100, Dow Industrial 30, Dow Transport 20, S&P100, FTSE100, NZ50
More will be added upon request
Unique Tiles Format:
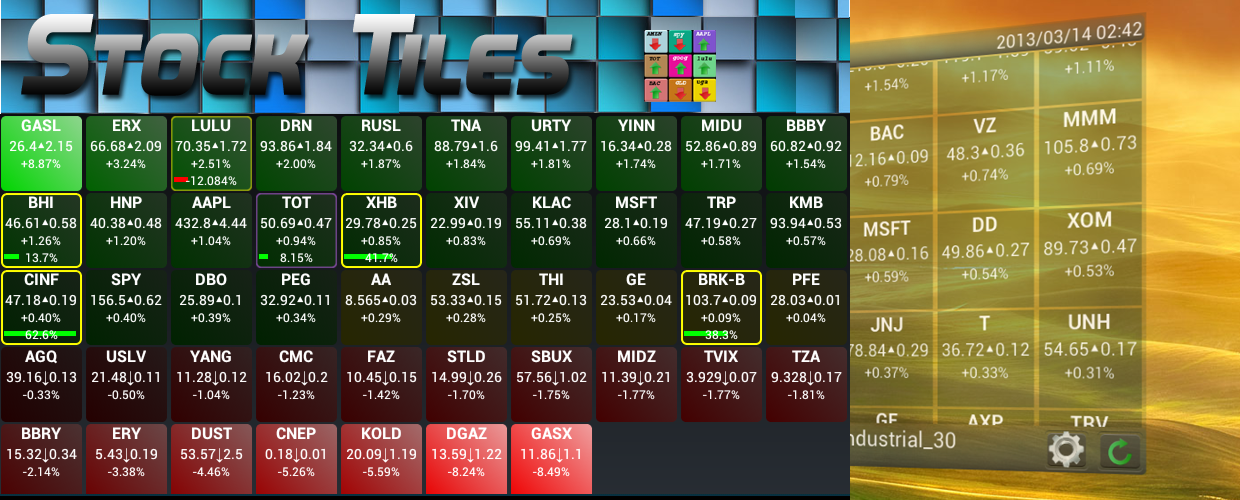
Human brains respond much more intuitively to visual cues than letters and numbers. That is why charts make more sense than table of numbers. Why not apply the same concept to portfolio tracking? Instead of reading tiny numbers and decimal points, one can quickly gauge the overall portfolio performance at one glance with colors and lines? The colors of tiles indicate daily % change, with the brightest GREEN for GAIN, and brightest RED for LOSS. The border thickness and color indicate your holding values and if it is long or short position. Performance bar at the baseline indicate your holding performance with respect to purchase / short price. Much of these can be customized to your individual style. The list view is also available if that is your preference.
The tiles can be sorted by daily % change, alphabetical, time added, holding value, holding performance. Other sorting order based on technical and fundamental indicators can be added upon request!
You will immediately know which stock in your portfolio or watchlist is gaining the most or suffering losses simply based on the colors. As well, the overall market performance can be felt with the overall colors of the tiles collection. You can then tap on the tile / stock of interest to open up the detailed quote page with charts and up to the minute news.
|
|
|


 論壇通告:
論壇通告:
 個人空間:
個人空間:

 論壇轉跳:
論壇轉跳:


 贊
贊  花籃
花籃  投訴
投訴 踩
踩  分享
分享


