Chinese Canadians Make More Than The General Population

Now for a number you won��t hear from StatsCan anytime soon, a breakdown of Chinese-Canadian incomes. The popular Chinese-Canadian forum Rolia.net conducted a survey on income, and had a massive response. The sampling was so large, we thought we��d compare it to general incomes across Canada. Turns out if you��re Chinese-Canadian, chances are stacked in your favor that you are one of the higher income earners in Canada.
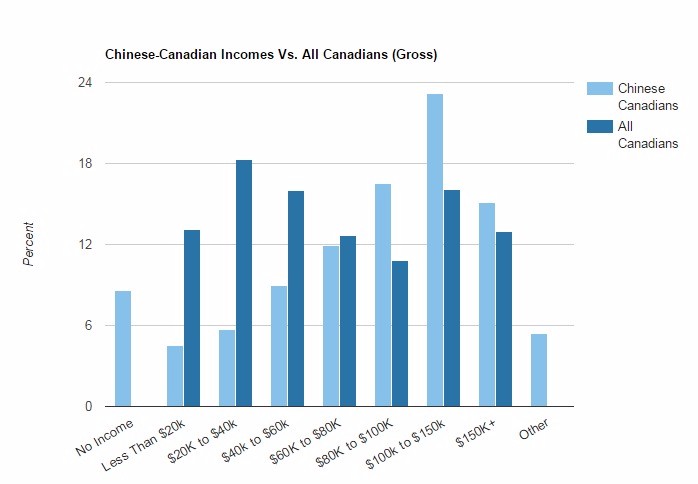
Chinese-Canadian Incomes Vs. All Canadians (Gross)ChineseCanadiansAllCanadiansNo IncomeLess Than $20k$20K to $40k$40k to $60k$60K to $80K$80K to $100K$100k to $150k$150K+Other06121824PercentIncomeChinese CanadiansAll CanadiansNo Income8.60Less Than $20k4.513.1$20K to $40k5.718.3$40k to $60k916$60K to $80K11.912.7$80K to $100K16.510.8$100k to $150k23.216.1$150K+15.113Other5.40
Source: Rolia.net, Statistics Canada.
Chinese-Canadians Are Overrepresented In Higher Income Brackets
When it comes to higher income brackets, Chinese-Canadians are overrepresented compared to the general population. For those that don��t know, overrepresented means proportionally higher than average. In the $80k �C $100k per year income bracket, the survey found that 16.5% of Chinese-Canadians fell into this category. The general population (which also includes Chinese-Canadians), saw 10.8% of all incomes fall into this category. In the $100k �C $150k per year bracket, the gap was even wider. 23.2% of Chinese-Canadians fit into this category, while just 16.1% of all Canadians fit into the category. In the $150k+ per year bracket, the gap contracts just a little. 15.1% of Chinese-Canadians fit into this category, while 13% of all Canadians were in this range.
The gap adds up to a lot when looked at as a whole. Around 54.8% of working Chinese-Canadians earn over $80k in gross income per year. To contrast, only 39.9% of all Canadians do. If you��re an analyst, you also probably noticed something about those numbers �C the ��All Canadians�� numbers include Chinese-Canadians. This means the numbers skew slightly, and the odds of earning more than $80k for non-Chinese-Canadians is slightly lower when looked at in total.
Chinese-Canadians Are Underrepresented In Lower Income Brackets
When it comes to lower income brackets, Chinese-Canadians are underrepresented compared to the general population. The number of Chinese-Canadians that earn less than $20k per year is just 4.5%. To contrast, 13.1% of all Canadians fit in this category. In the $20k �C $40k income bracket, the gap was widest. Only 5.7% of Chinese-Canadians fit in this bracket, while 18.3% of all Canadians do. The gap tapers a little in the $40k �C $60k per year bracket. 9% of Chinese-Canadians fit in this category, while 16% of all Canadians fit in this range. The $60k �C $80k income bracket is the closest. 11.9% of Chinese-Canadians fit here, compared to 12.7% of the general population.
Once again, all of these numbers add up to a pretty big gap. Only 31.1% of Chinese-Canadians earned under $80k per year. To contrast, 39.9% of all Canadians fit in the same income brackets. Once again, the numbers do have a slight skew since ��All Canadians�� includes Chinese-Canadians.
Data Explained
Before you dismiss this as ��just a survey,�� let��s run through the issues on both sets of data �C both Rolia��s survey and Statistics Canada. The Rolia survey has 2,363 respondents when we took a snapshot. That seems relatively small, until you realize that Statistics Canada��s Labour Force Survey (LFS), the primary way we determine unemployment numbers and wages, is 50,000 people. Considering Chinese-Canadians are roughly 4% of the population, a sample size that��s 4.7% of the LFS is a pretty large sample.
Just because Rolia doesn��t have a 3,000 person workforce like Statistics Canada, doesn��t mean the results are less accurate. Actually, both sets of data have issues and leave us with questions. Such as, 5.4% of respondents on the Rolia survey said they made ��other.�� Not no income or negative income, other. I��ve never heard of a salary negotiation where someone asked ��what income are you expecting?�� and someone reply ��other.�� Have you?
Likewise, the Statistics Canada survey marks no income as ��not reliable�� �C and doesn��t give a number. Yay! All Canadians have income! Not exactly. It just means not enough people told a stranger on the phone that they didn��t make any money this year. The only advantage to the Statistics Canada number is they spent hours structuring a geographic sampling of regions. So the geography is known, so that��s a plus.
|


 ��̳ͨ��:
 ���˿ռ�:

 ��̳ת��:


 ��
��  ����
����  Ͷ��
Ͷ�� ��
��  ����
����


